tHe DiStRiCt WiLl Be InSoLvEnT
After last week's great turnout at the board meeting march downtown, I have heard a number of people concerned about the presentation that District Management made in regards to the budget. The district is claiming, yet again, that they don’t have the money. It has appeared that they got all this money, it didn’t go to us, and they immediately lost it in the couch cushions.
The big kapow from management’s presentation was that graph with the very negative red bars showing the district will be hemorrhaging money if they accept APT’s offer. There are a few things at play with this, first of which being the way future budgets are estimated. I know absolutely nothing about this process, but from the historic data, our district has not been good at it. They always underestimate, and over the last few years, it appears as though they are getting worse at it.
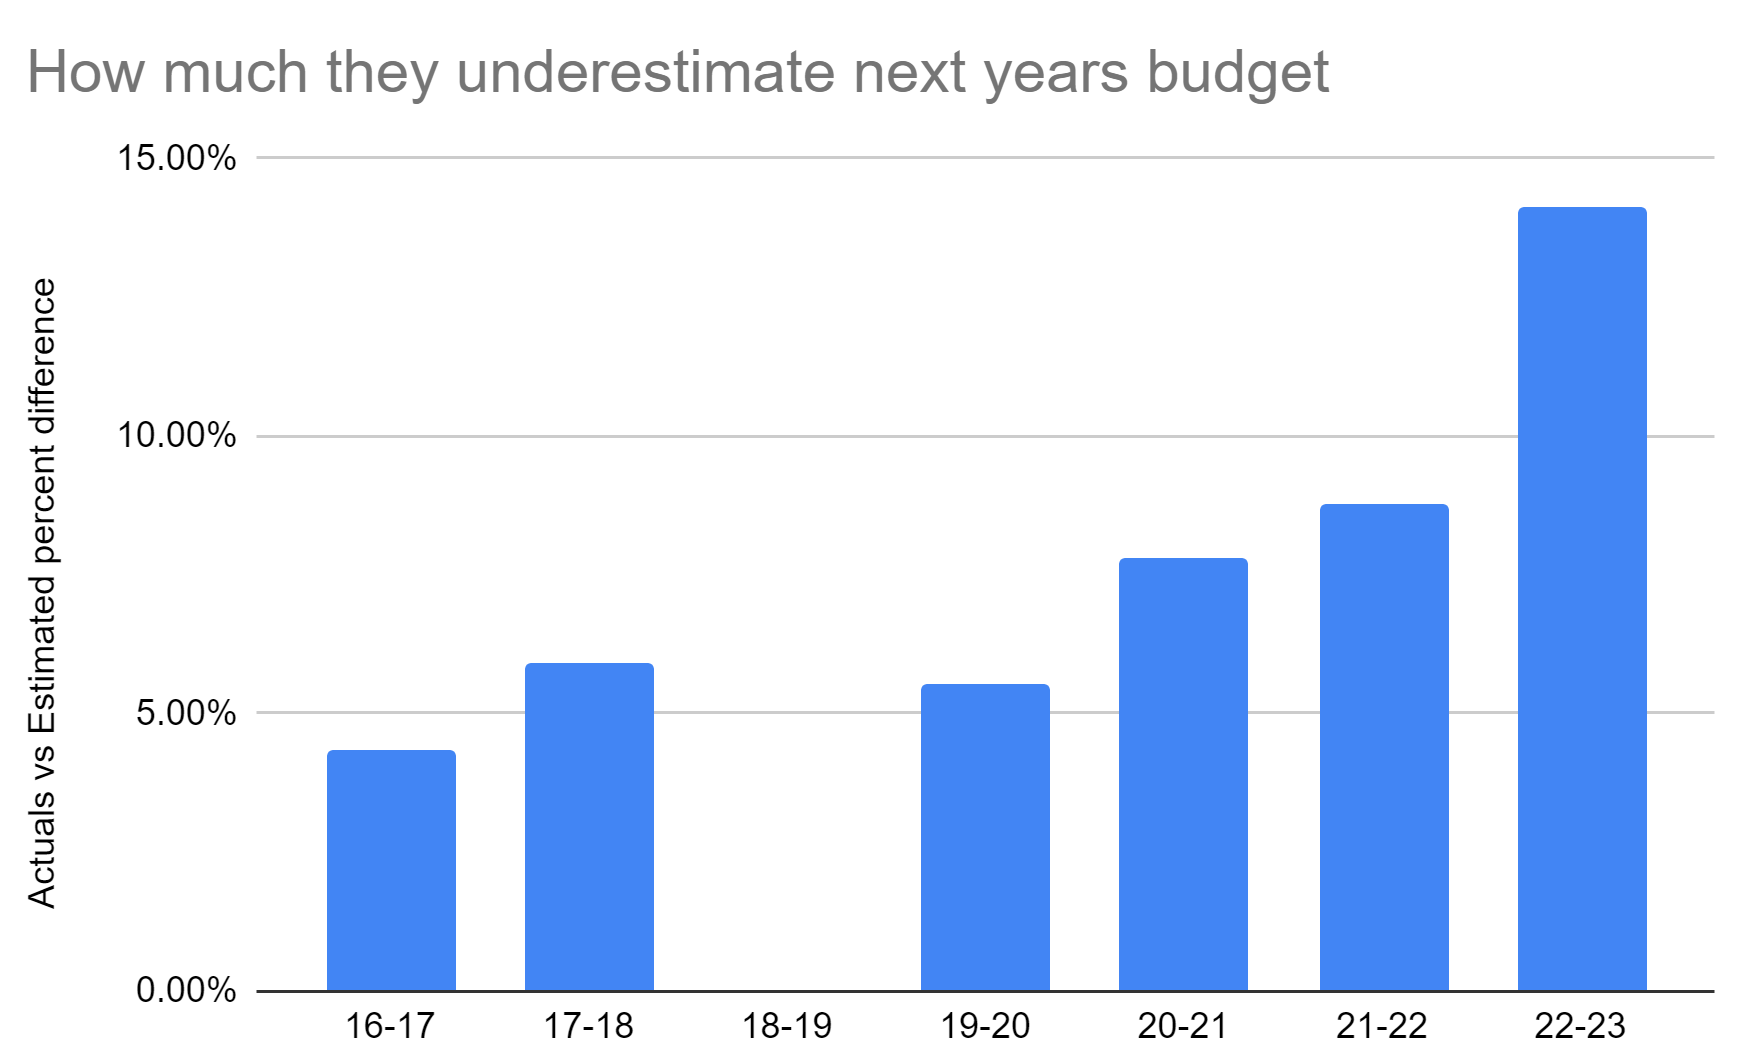
Figure 1. Over the last 7 years (and probably longer, but I couldn’t look), the district has been underestimating the budget. This leads to the appearance of no money. In 22-23 this underestimate was $27.6 million. *Note that 18-19 is missing because management does not know how to maintain and exhibit accurate data records. Spreadsheet for reference
This leads to the 23-24 budget (and by extension the 24-25 budget). The district is predicting insolvency, but they are also estimating the 23-24 budget will be $205 million when this year’s budget is $223 million. Over the last 7 years of data available on the PUSD website, the district has not had a reduction in funding, they have always had an increase. Therefore, it seems unlikely that next year will see a reduction in funding, and very unlikely that the budget will be reduced by $18 million, almost 10%.
So where does all this unexpected money go?
For the 22-23 budget, management claims they are still running in a deficit despite receiving an additional $27.6 million. I have already spoken to this before, but there was a transfer of $30.8 million from the unrestricted fund to the restricted fund. This generated a $9.5 million surplus in the restricted fund while leaving a deficit of $2.3 million in the unrestricted general fund. So when district management points to the deficit and claims they have no money, they are simply not telling the truth. There is money, management is just making the choice not to pay teachers.
This creates an issue that is above mathematical analysis. When the district underestimates the next year’s budget, they can make a “truthful” claim that they have no money for raises, but that’s because they underestimated the budget, so then when the actual budget comes in, and they have a bunch of surplus, they have to hide it in a place we can’t get it: the restricted fund. This is perpetual. Again, this is not based on mathematical analysis, it is subjective. The district is making a choice to not prioritize teachers, and therefore not prioritize the best education for students.
So why do they underestimate?
I have no idea. My guess is they point to the declining enrollment and say “See.” But would declining enrollment actually lead to no money for teachers? Because that makes no sense. The numbers presented on their presentation show about 200 less students per year, or about 7 or 8 full time teachers (roughly 1% reduction in staff). This is less than $1 million, not insignificant, but certainly not budget breaking. So this can lead to one of 2 things:
Option 1. Smaller class sizes. Heaven forbid our district actually does something positive to increase learning. Smaller class sizes is one of those things that every piece of research shows improves education across the board, yet this is something that APT has to bargain for at the expense of our own raises. The district should be pushing for this always. High school classes in PUSD regularly have class sizes of 36 or more. In Dublin and Livermore, classes are capped to 33 max.
Option 2. Less teachers. I don’t mean to lay-off teachers, but the declining enrollment will fit nicely with the retiree process, so the district will simply not have to hire out for unneeded positions.
They point to data like declining enrollment, but they don’t take into account the reduction in cost or the positive impacts of this. I don’t know if this is done intentionally or unintentionally.
How does this compare with COLA?
The last slide (other than the watermarked thank you slide) was especially upsetting. This was shown to compare the raises vs COLA over the last 10 years, and while our raises were of course lower, it doesn’t look so bad, well at least that’s the story that was told. What this doesn’t show was the few years before. They very intentionally started this slide from 2014 because that was our first meaningful raise in a while. Let’s look at the few years before:
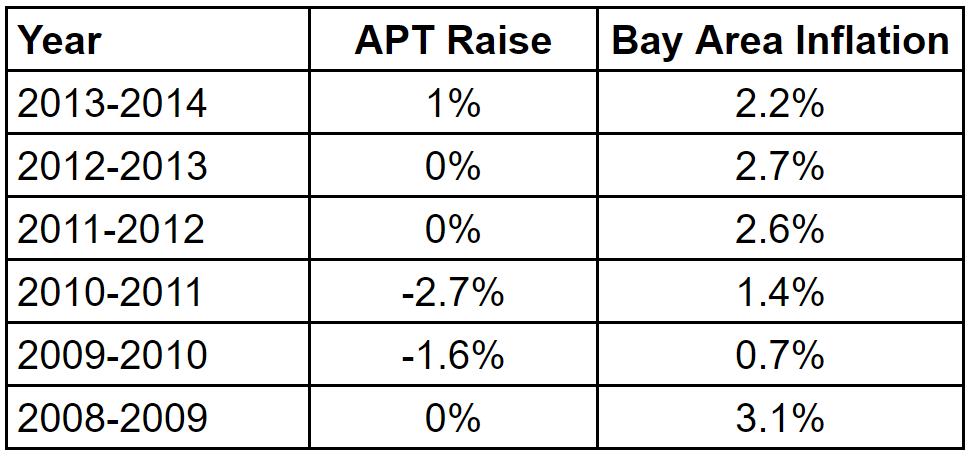
Figure 2. Data showing the APT raises over the years before what management showcased in their presentation. Note that I used Bay Area Inflation data as I did not have access to the district COLA.
On a side note, do they even know how to math? This slide is full of percentages that were added. Added! Everybody knows that percent changes year over year compound, so they need to be converted into decimal form, added to one, and then multiplied. Anybody that knows numbers should know better.
Copyright 2020 All Right Reserved By. Free html Templates